Chart
The Chart makes your data pop, and it is easy to use. It provides you with multiple charts like Bar, Column, Line, and more.

Chart Preview
h1
h2
Documents
Features
Charts
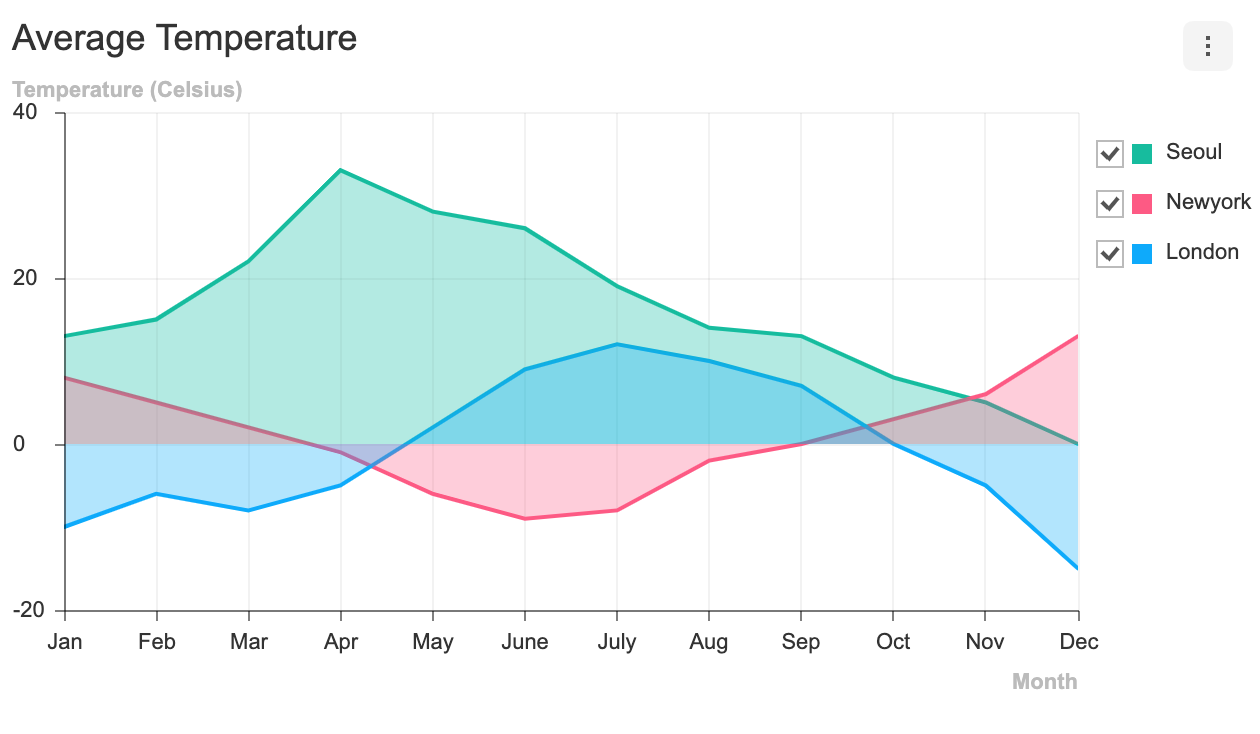
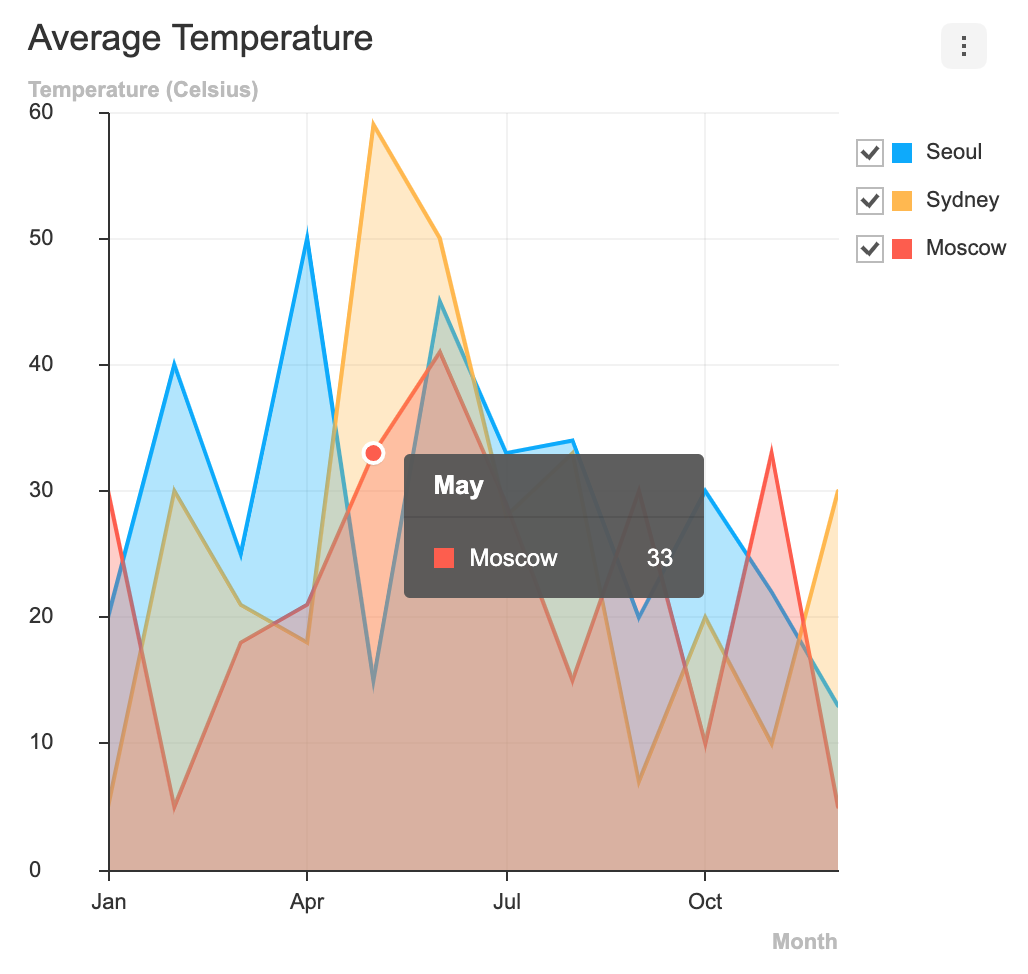
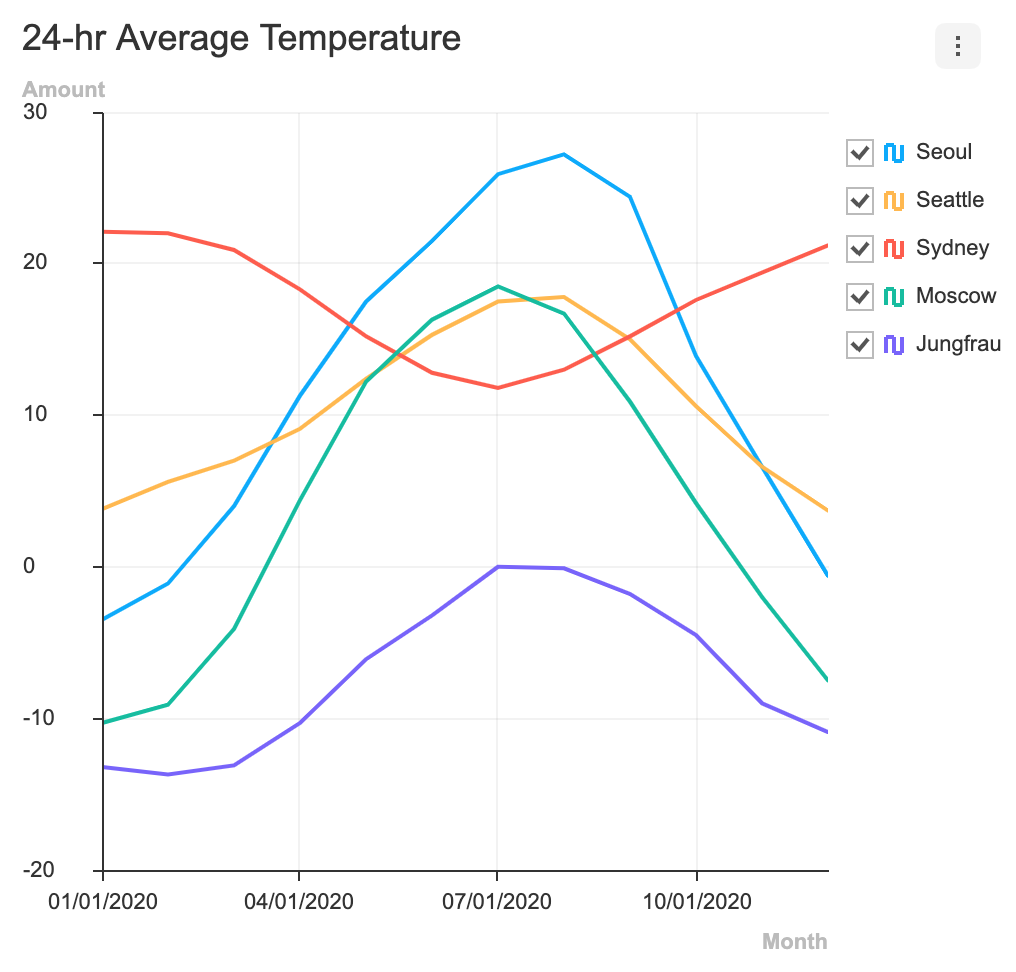
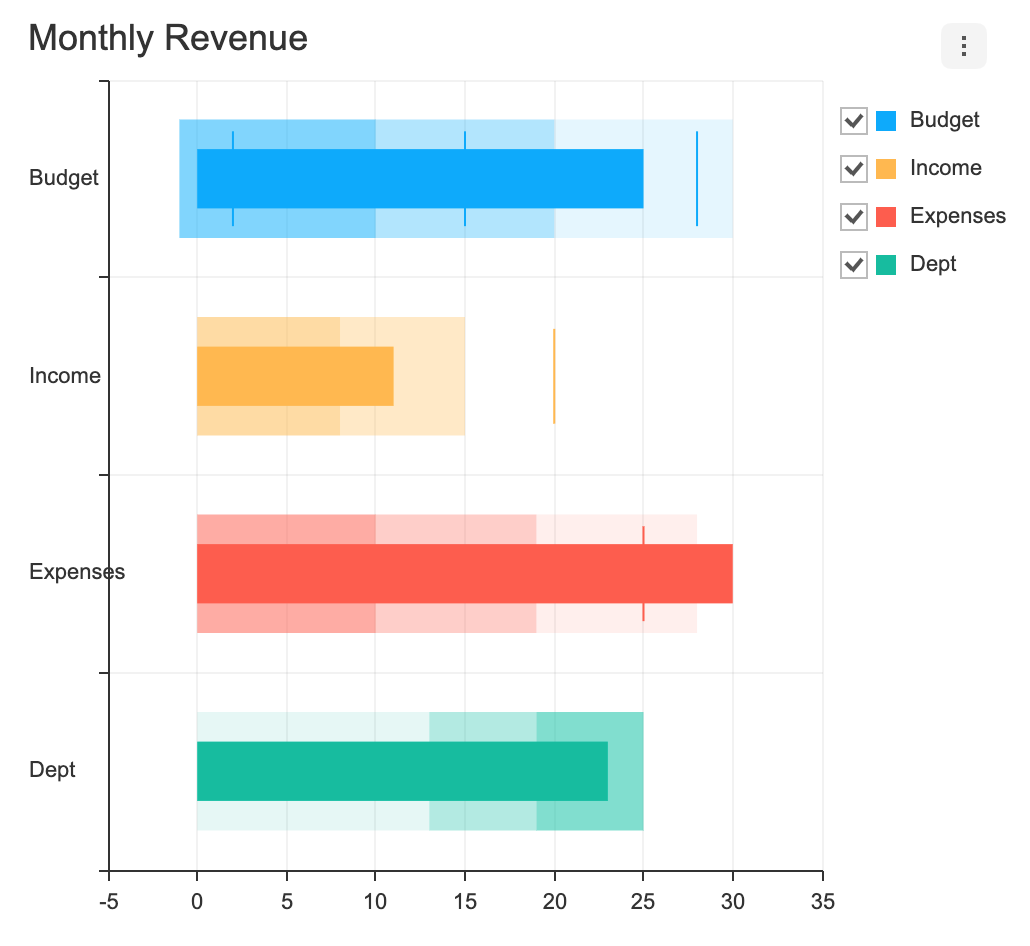
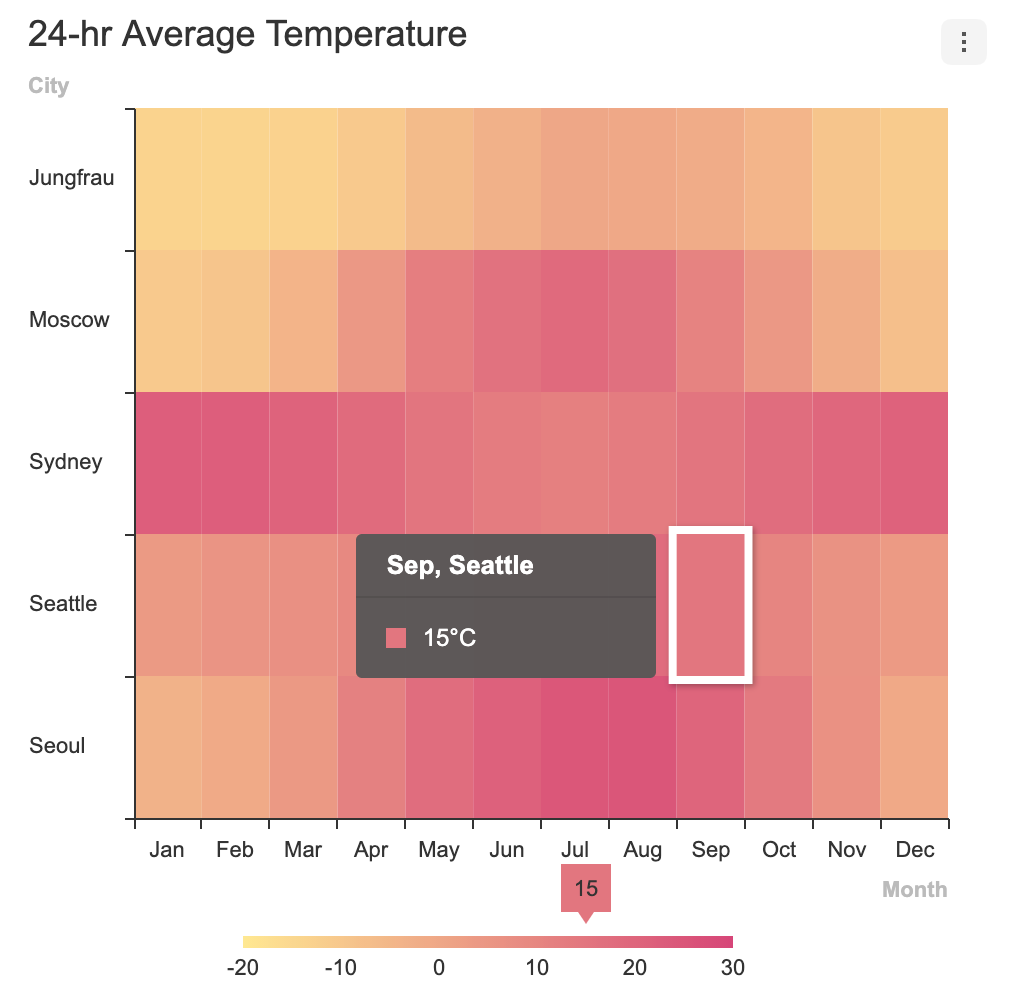
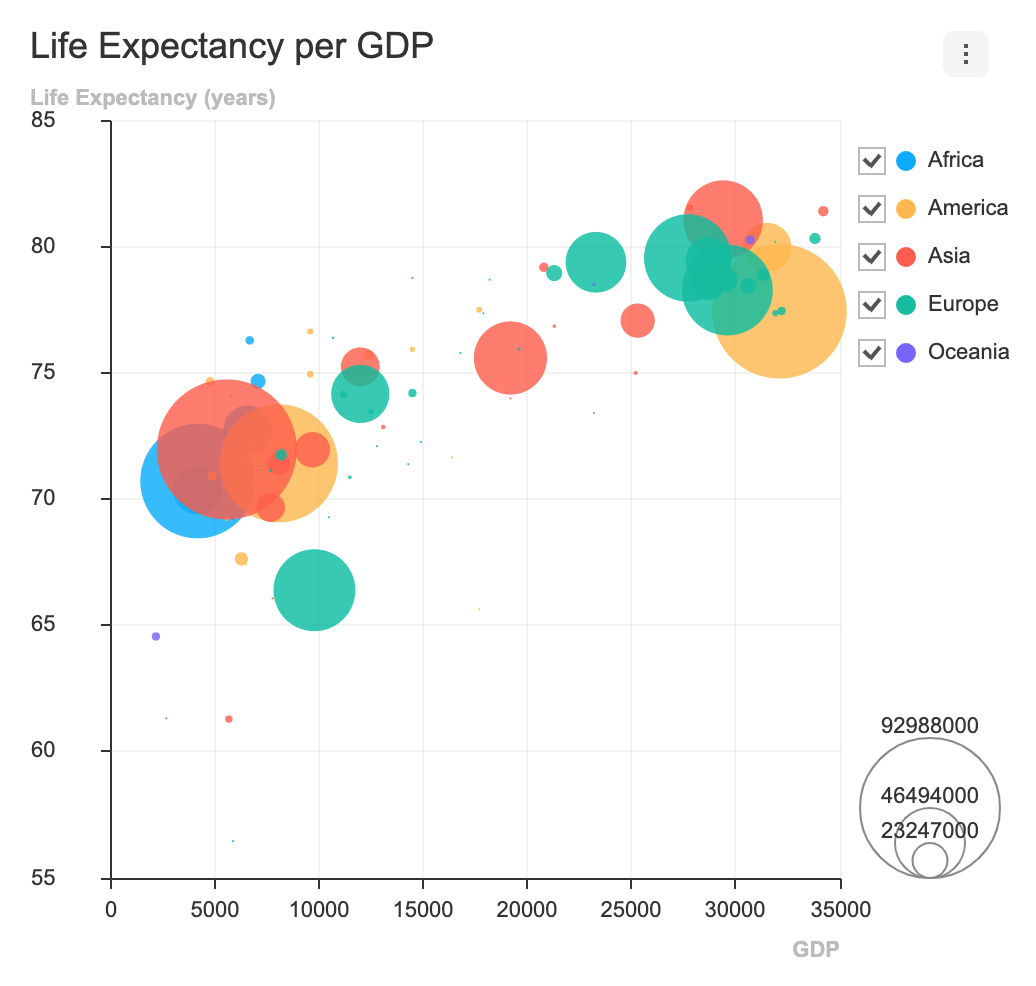
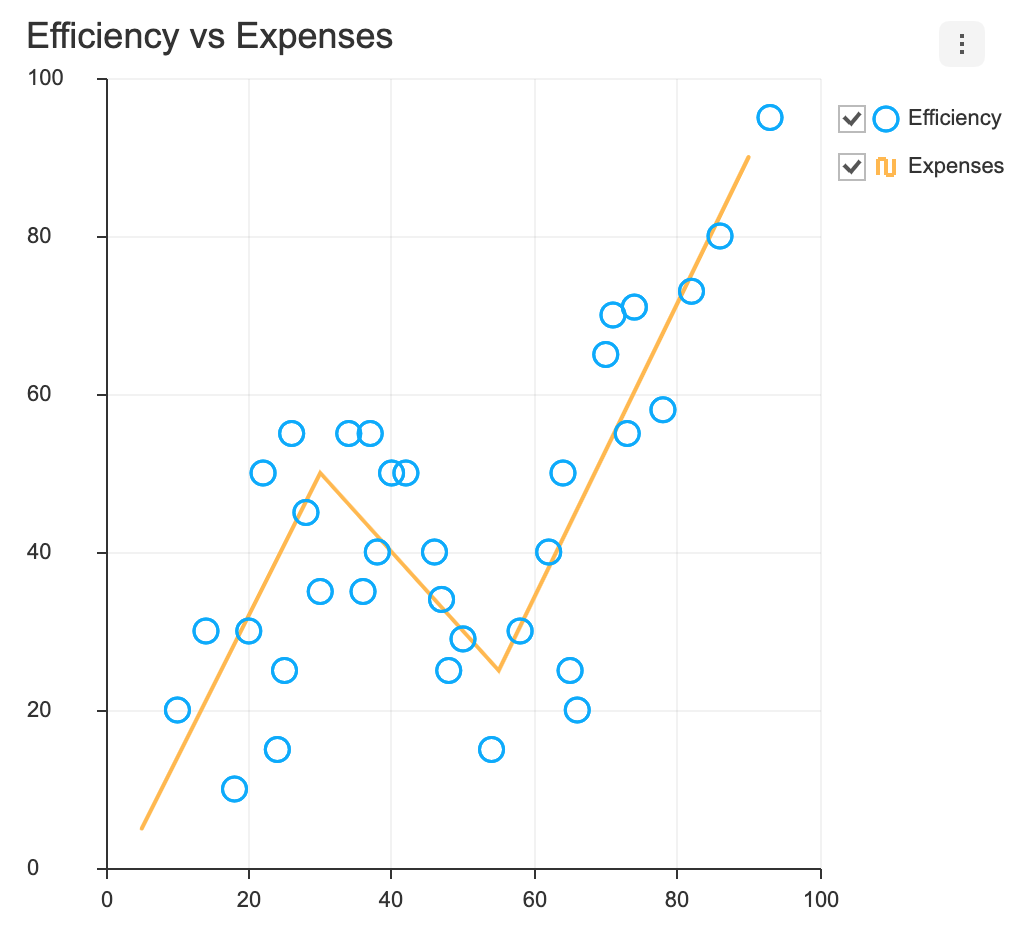
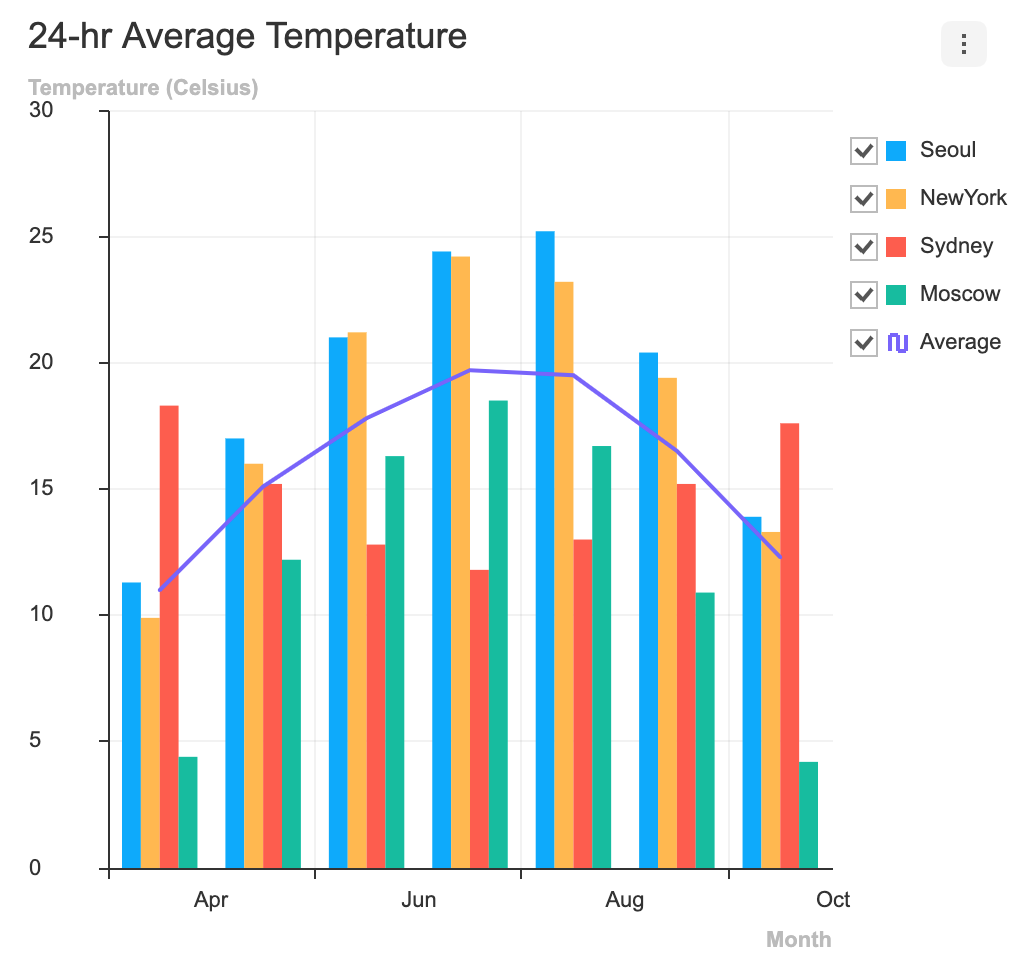
The TOAST UI Chart provides many types of charts to visualize the various forms of data.
| Area | Line | Bar | Column |
|---|---|---|---|
 |
 |
 |
 |
| Bullet | BoxPlot | Treemap | Heatmap |
|---|---|---|---|
 |
 |
 |
 |
| Scatter | Bubble | Radar | Pie |
|---|---|---|---|
 |
 |
 |
 |
| LineArea | LineScatter | ColumnLine | NestedPie |
|---|---|---|---|
 |
 |
 |
 |
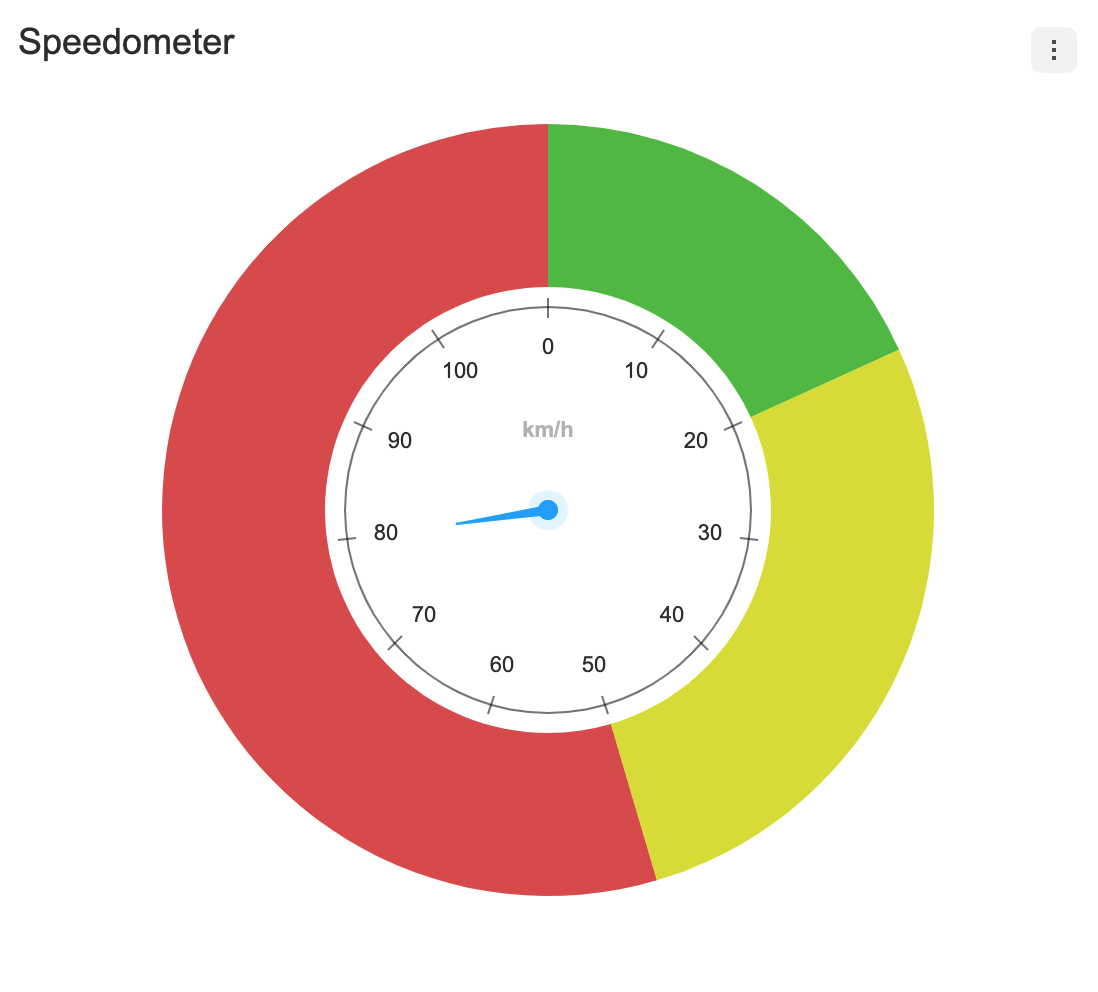
| RadialBar | Gauge | ||
|---|---|---|---|
 |
 |
 |
 |
- Stack Options(Explained in each chart guide)
- Diverging Options(Explained in each chart guide)
- Change Event Detect Type(Explained in each chart guide)
- Custom Theme
- Custom Tooltip
- Export
xls,csv,png,jpegfile - Live Update
- Responsive Layout
In addition, a variety of powerful features can be found on the demo page below. 👇👇👇
Examples
- Line Chart
- Area Chart
- LineArea Chart
- Bar Chart
- Column Chart
- ColumnLine Chart
- Bullet Chart
- BoxPlot Chart
- Treemap Chart
- Heatmap Chart
- Scatter Chart
- LineScatter Chart
- Bubble Chart
- Pie Chart
- NestedPie Chart
- Radar Chart
- RadialBar Chart
- Gauge Chart
Here are more examples and play with TOAST UI Chart!
Contributing
Browser Support
 Chrome Chrome |
 Internet Explorer Internet Explorer |
 Edge Edge |
 Safari Safari |
 Firefox Firefox |
|---|---|---|---|---|
| Yes | 10+ | Yes | Yes | Yes |
TOAST UI Family
Used By
- NHN Cloud - Total Cloud Service
- NHN - ToastCam
- NHN Dooray! - Collaboration Service (Project, Messenger, Mail, Calendar, Drive, Wiki, Contacts)
- NHN - Smart Downloader
- NHN - Gamebase
- NHN Edu - iamTeacher
- HANGAME
- Payco
License


