Performance Optimization
Application performance optimization is important on both levels of the web and the application itself. Modern web applications have become very large and dense with features including Ajax communications and complex UI. Heavier webs eventually lead to longer loading time and negatively affect the User Experience (UX). Pinterest, for example, had high rates of users leaving the page due to long loading time, and through performance optimization, decreased the bounce rate and increased the revenue by 40%. As the performance is clearly and directly linked to profit, it is critical to optimize the web application’s performance. This guide serves to provide the readers with basic background knowledge of performance optimization, and to introduce various optimization methods by discussing the webpage loading and rendering stages separately.
Table of Contents
Theories and Measuring Tools Required for Performance Optimization
In order to effectively optimize the performance, knowledge of performance concepts and jargons goes a long way. This chapter will focus on the process browsers go through to load a page, and will explain the technical jargons and indices used to measure performance at each stage. Also, this chapter will introduce using Chrome DevTools to measure performance.
How Browsers Load
Browser goes through multiple behind the scenes operations, like downloading the necessary resources, transpiling said resources, and etc., to display the content on the screen. These operations consist of download, parsing, style, layout, paint, and composite, and are collectively referred to as the loading phase. Let’s explore what happens at every stage.
1. Parsing
First, when a page is loaded on the browser, the browser downloads the HTML files. Parsing is a stage where the browser converts the downloaded HTML in order to construct the DOM Tree. If the browser discovers <script/>, <link/>, or <div/> elements during the parsing stage, it requests the appropriate resources and downloads them as well. If the CSS is included in either the HTML or the resources, it constructs the CSSOM Tree at the same time. The constructions of DOM Tree and CSSOM Tree are explained in greater detail below.
DOM Tree Construction
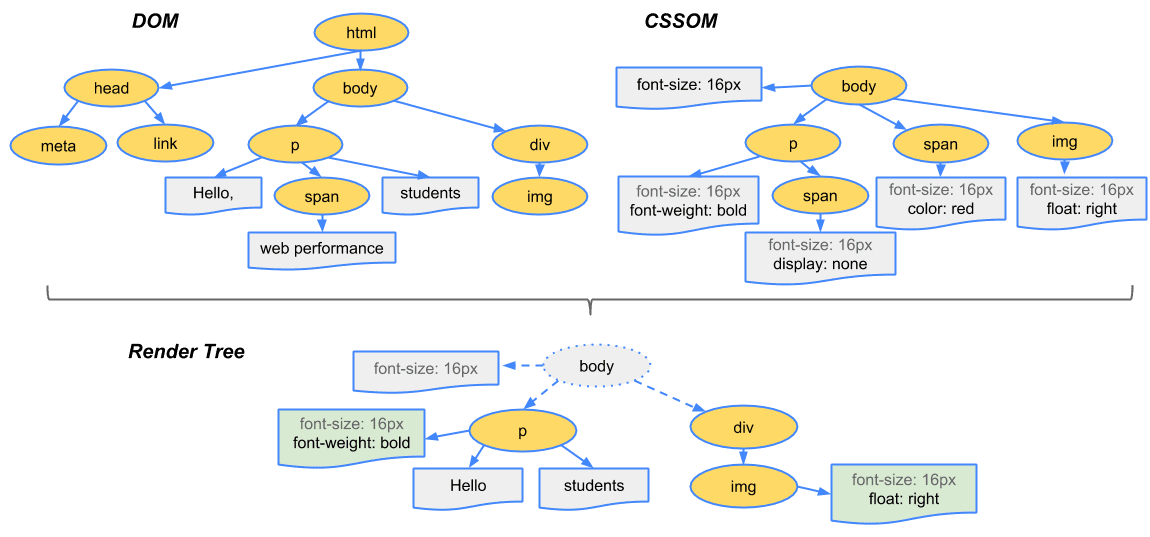
To better explain the DOM Tree construction, let’s refer to the following HTML file. When parsing happens, the browser analyzes the HTML file to create the DOM, and connects each DOM object in a tree data structure to establish parent-child relationships. Tags like <body>, <p>, and <div> are created as nodes in the DOM tree and reference child nodes.
<html>
  <head>
    <meta name="viewport" content="width=device-width,initial-scale=1">
    <link href="style.css" rel="stylesheet">
    <title>Critical Path</title>
  </head>
  <body>
    <p>Hello <span>web performance</span> students!</p>
    <div><img src="awesome-photo.jpg"></div>
  </body>
</html>
(Image Source : Constructing the Object Model)
CSSOM Tree Construction
As in the example above, if the file includes an external stylesheet file or an internal stylesheet like the style.css, the browser translates the CSS and constructs the CSS Object Model (CSSOM) Tree. Selectors like body, p, and span are used as nodes and each node references different styles.
/* style.css */
body { font-size: 16px }
p { font-weight: bold }
span { color: red }
p span { display: none }
img { float: right }
(Image Source : Constructing the Object Model)
2. Style Calculation
During the style calculation stage, the browser builds another tree by using the DOM and CSSOM Trees constructed during the parsing stage, to match each element to the corresponding style. The image below depicts how the render tree is crafted by combining the two trees built during the parsing stage.
 (Image Source : Render Tree Construction, Layout, and Paint)
3. Layout
In the layout stage, the browser mathematically calculates the exact position and size of the node. In order to do so, the browser starts at the root and calculates each node by iterating through the entire tree, and applies the results of the layout at the exact location with the exact number of pixels in the render tree. The image below shows the before and after of the layout. If the percentage representation was used in the CSS to denote size, after the layout, the % representation gets converted to the pixel units.
Before Layout
 (Image Source : Render Tree Construction, Layout, and Paint)
레이아웃 후
After Layout

4. Paint
In the previous layout stage, each node in the render tree was converted into actual pixels by using the computed properties. Now, the browser applies the CSS properties that are not related to the positioning of the element like color and transparency. Then, the pixelated results are crafted into layers like that of the Photoshop, and are managed in layers. However, not all elements are transformed into layers. The transform property build them into layers, and this process is called painting.
5. Compositing and Rendering
The browser updates the screen with a composite of layers created in the paint stage. The page can finally be viewed on the screen after the compositing and rendering process are finished.
The image below depicts the browser loading phase. In order to fully understand how the web application could be improved, it is important that the developer has working knowledge of the browser loading phase.
 (Image Source : Quantum Engine)
Layout and Repaint
The browser loading stages after the style calculation (style calculation -> layout -> paint -> composite) are collectively referred to as rendering. This rendering process can happen multiple times depending on the situation. The render tree, constructed during the style calculation stage, must be reconstructed every time the DOM Tree or the CSSOM Tree change because of JavaScript. If, for example, DOM has been inserted/removed or if a CSS element that has a geometric effect on the design (height, width, position) is changed, the render tree must be reconstructed. Therefore, the process must be repeated from the layout stage, and this process is called a layout. (It is also referred to as reflow in Firefox.)
 (Image Source : Rendering Performance)
As mentioned above, layout occurs when a CSS element that affects the geometry changes, but contrarily, if a change has been made that does not affect the geometry of the structure, the browser engine skips the layout stage. The process continues from the paint stage, and this process is called repaint.
 (Image Source : Rendering Performance)
If a layout happens, the engine must reevaluate the entire display into pixels again, so it puts pressure on the engine. However, repainting only asks that the browser use already-calculated pixel values to paint the display, so is relatively easier on the browser. The example codes below demonstrate the difference between the time it takes with a layout and the time it takes with a repaint.
<div id="sample" style="background:red;width:150px;height:50px;">
  Sample
</div>
Changing the value of an element's attribute with geometric effects.
- CSS Attributes :
height,width,left,top,font-size,line-heightetc.
const example = document.getElementById('example');

example.style.width = '400px';- Layout Occurs

Changing the value of an element's attribute without geometric effects
- CSS Attributes :
background-color,color,visibility,text-decorationetc.
const sample = document.getElementById('example');

example.style.backgroundColor = 'blue';- Repaint Occurs

Note : List of CSS Attributes that Cause Layouts and Repaints
As demonstrated above, if a layout occurs, the rendering time increases as the execution time increases. Therefore, it is critical to make sure that unnecessary layouts do not happen.
Block Resources and Critical Rendering Path
In the early stages of loading the browser, when the parsing is happening, the parsing can be halted if the browser runs into CSS or JavaScript. Such situation is often described as ”the HTML parsing being blocked,” and such blocking resources are called block resources. Block resources delay the paint stage of the loading, so developers must take extra caution to prevent block resources from blocking the HTML parsing. Google explains that the loading speed can be improved by optimizing the Critical Rendering Path (CRP), and this will be discussed in greater detail in the next section.
Performance Improvement Index
So far, this document has explored the possible elements that could aversely affect the loading process. Now, let’s discuss how to improve the loading process. In order to find what could be improved, on which basis the loading speed is slow must be made clear. The performance index’s measurement standards can mainly be categorized into two: the browser perspective and the user perspective. The following paragraphs will further illustrate how the two categories are different, and will also introduce the index used to measure performance.
Performance Measurement from the Browser’s Perspective
The traditional method of measuring performance was to use the events taking place in the browsers as milestones. When the page loads, DOMContentLoaded and load events occur, and the performance was measured based on when each event occurred. The image below is an example of the Processing Model of the Navigation Timing, and this model declares that the faster the DOMContentLoaded event (underlined in blue) and load event (underlined in red) occur, and the shorter the delay between the two are, better the performance will be.

The specific points of occurrence of DOMContentLoaded and load events are as follows.
DOMContentLoaded Event
- When the HTML and CSS parsing have finished
- When the engine is ready to construct the render tree (DOM and CSSOM have been constructed)
load Event
- When all resources on the HTML have been loaded
The points of occurrence for both of these events can be monitored by using the Chrome DevTools or by using the navigation timing API.
Using the Navigation Timing API
Browsers provide Navigation Timing API so that developers can measure the page’s performance. Using the domContentLoadedEventStart property of PerformanceNavigationTiming in the Navigation Timing API and by using the loadEventStart, developers can access the point of occurrence for DOMContentLoaded and load events, respectively.
Using the Chrome DevTools
Chrome DevTools provide numerous UIs and methods to check points of event occurrence and to measure performance. In the lower half of the DevTools, the points of occurrence forDOMContentLoaded and load events are printed in blue and in red, respectively. Using the Chrome DevTools allows developers to monitor the points of occurrences more easily than using the Navigation Timing API.

However, as the development paradigm continues to change, it became difficult to judge the application’s performance solely on the points of occurrence of DOMContentLoaded and load. Recently popular Single Page Applications (SPA) have very early point of occurrence for DOMContentLoaded and load events, but still have slow loading due to other scripts that continue to run. Therefore, the developer community had to come up with a method to measure performance from the user’s perspective.
Performance Measurement from the User’s Perspective
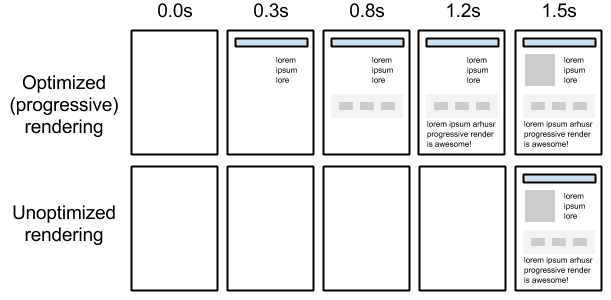
Measuring performance from the user’s perspective is based on multiple timestamps of the content being displayed to the user. The faster the meaningful content is displayed to the user, the better the performance is, and developers should attempt to optimize the code to make it happen faster. The image below is a comparison of two rendering scenarios, both with concurrent DOMContentLoaded and load event occurrences, where one code has been optimized and the other has not. In the case of the optimized code, at 0.3s, pieces of the content is visible and the page loads gradually. However, in the case of unoptimized code, first display becomes visible after 1.5s of blank space. Most users will feel that the optimized code is “faster.”
(Image Source : Critical Rendering Path)
Google has defined multiple moments that the user feels that the page has loaded quickly or not, and such moments as indices to measure performance. Such moments are described as follows.
First Paint (FC)
The moment something appears on the blank page
First Contentful Paint (FCP)
The moment a text or an image begins to be printed
First Meaningful Paint (FMP)
The moment the content that could be useful to the user is printed. CSS and JavaScript needed to display the content has started to load and the style has been applied so that the content is apprehensible.
Time to Interactive (TTI)
The moment JavaScript has finished executing so that the user can perform actions

The FMP is the most important among them, and it is critical to display useful information to the users before the loading finishes in order to leave an impression that the application is fast. From the user’s perspective, good performance means fast FMP, and such can be achieved by optimizing the aforementioned critical rendering path.
Performance Measuring Tools
The aforementioned DevTools are provided by the Chrome browser, and it can be used to verify everything that has been discussed so far. DevTools offer three panels related to performance, and they are Network, Performance, and Audits. This chapter will explain the roles and usages of each panel, and the following chapter will explain actually applying them to projects. (This section is based on Chrome v70.)
Performance Panel
Performance panel enables users to monitor each of the previously mentioned loading stages in charts. As a page loads, each loading stage is recorded, and time to a certain event can be monitored as well. This panel is mainly used to pin point which area of the loading process has to be optimized.
Panel Information
-
(1) Controls : Includes buttons to start and clear recordings.
- First button is used to manually control recordings.
- Second button is used to automatically start recording as the page refreshes, and when it finishes loading, it will stop recording.
-
(2) Capture
- Screenshots : Displays different rendering states with respect to time
- Memory : Displays the Heap Memory State
- Garbage Collection : Manually enable garbage collection
- (3) Overview : Displays the overview of the loader
- (4) Main : Displays the area selected in the Overview section in detail
- (5) Details : Displays detailed information about the area selected in the Main section.

Inspecting the Web Page Loading Process
The entire loading process can be inspected by using the controls to record the entire process, and then be monitored in the Main area.
Network Panel
The Network panel can be used to monitor the statuses of the resources requested during the loading process, and is used to compare and optimize resource states. Like it did in the Performance panel, the resource request information can be found in the Overview and Request Table when the recording is finished. The resource list is arranged according to time, and the corresponding server request response time is accessible by clicking on the charts. Also, the points of occurrence for DOMContentLoaded and load are printed at the bottom.
Panel Information
- (1) Controls : Controls how the panel is displayed and how it operates.
- (2) Filters : Filters which resources to be made visible.
- (3) Overview : Displays the overview of the flow of requests and downloads.
- (4) Request Table : Displays the status of every resource request and download detected.
- (5) Summary : Displays the total number of requests, size of transmitted data, and event load-time.

Monitoring Server Request Response Time
-
(1) Queuing : Time spent on queue
- JavaScript and CSS have higher priority
- TCP Socket Queue
- TCP Connection Timeout Queue
- Disk Cache Formation Queue
-
(2) Stalled : Stalled time before the request is sent
- Time spent in the Queueing
- Time required for proxy negotiation
- (3) DNS Lookup : Time spent on DNS Lookup
- (4) Initial Connection : Time spent on TCP Handshake/Retry and Connection establishment including SSL
- (5) Waiting (TTFB) : Time spent waiting for Time-to-First-Byte.
- (6) Content Download : Time spent on actually downloading the resource

Audits Panel
Audits panel can be used to monitor the performance measurement index from the user’s perspective. The screen is mainly divided into two—before and after, and in the before section of the screen, the developer can specify in which environment to measure the performance. Throttling area is configured if a simulation of a slow network is required, and the performance measurement starts when the “Run audits” button is selected. The results are displayed afterwards.
Before Audits

After Audits
-
(1) Metrics : Displays the moments specified in the performance measurement index
- Displays the FCP, FMP, and TTI timestamps
- Displays the page loading stages in screenshot
- (2) Opportunities : Displays a list of possible resources that are optimizable
-
(3) Diagnostics : Displays other possible improvable features and respective solutions
- Refer to “Critical Request Chains” to optimize the Critical Rendering Path
- (4) Passed audits : Displays the passed audits with evaluated standards

Webpage Loading Optimization
Following sections will discuss actually optimizing the loading process based on the materials discussed in previous sections. Webpage loading optimization will be based on critical rendering path optimization.
Block Resource (CSS, JavaScript) Optimization
Previously, it has been mentioned that block resources could occur during the browser loading phase, and CSS and JavaScript are such block resources. Optimization of such block resources is the first part of the optimization.
CSS Optimization
In order to construct the render tree, the browser needs DOM tree and CSSOM tree. While DOM tree can be built as the browser runs into each tag during the parsing stage, but CSSOM tree can be constructed only after the CSS has been completely converted. Therefore, if the CSSOM tree has not finished its construction, the render tree cannot be built, and it blocks rendering. For such reason, CSS is known as a render blocking resource, and the CSS should always be located in the <head> tag in order to avoid render blocking.
<head>
  <link href="style.css" rel="stylesheet" />
</head>
Furthermore, if a piece of CSS is only required for special circumstances, using media queries can prevent blocking from happening. For example, if a piece of CSS is only used to print the page (print.css) or if the display is in portrait mode (portrait.css), specify the media attribute in the <script> tag so that it only loads under special circumstances.
Before Optimization (Media Queries Not Used)
<link href="style.css" rel="stylesheet" />
<link href="print.css" rel="stylesheet" />
<link href="portrait.css" rel="stylesheet" />
After Optimization (Media Queries Used)
<link href="style.css" rel="stylesheet" />
<link href="print.css" rel="stylesheet" media="print" />
<link href="portrait.css" rel="stylesheet" media="orientation:portrait" />
Also, when importing stylesheets from external sources, avoid using @import. Since the browser cannot download different stylesheets parallelly, @import can unnecessarily increase the loading time.
/* foo.css */
@import url("bar.css")
Also, consider using internal stylesheets given the right circumstances.
<head>
  <style type="text/css">
    .wrapper {
      background-color: red;
    }
  </style>
</head>
JavaScript Optimization
JavaScript is categorized as a block resource that halts HTML parsing because it is able to dynamically manipulate the DOM tree and CSSOM tree. When the browser engine runs into the <script> tag, it must execute the script, and the script only has access to the DOM that has been constructed so far. Also, until the script finishes executing, the construction of DOM tree is put on hold. If the screen has to be downloaded from an external source, the construction has to wait until the engine finishes downloading all of the external resources and executing them. This is why JavaScript is classified as a blocking resource, and should always be placed at the bottom of the document (immediately before </body> tag.)
<body>
  <div>...</div>
  <div>...</div>
  <script src="app.js" type="text/javascript"></script>
</body>
There is a way to prevent JavaScript and CSS scripts interrupting the HTML parsing process even if they are included in the <head> tag. Such can be done by assigning the <script> tag with defer or asnyc attributes. The defer and asnyc attributes declare that they will not attempt to change the DOM or CSSOM, so that the browser does not have to stop the parsing process. However, it is important to note that these attributes are limited in browser compatibility.
<html>
  <head>
    <script async src="https://google.com/analatics.js" type="text/javascript"></script>
  </head>
  <body>
    <div>...</div>
    <div>...</div>
  </body>
</html>
Comparing Before/After of Block Resource Optimization Using Chrome DevTools
Let’s compare the before and after of using the Performance panel from the Chrome DevTools to optimize block resource usage. Inspecting the loading process of the page that hast not yet been optimized, the block resource is executed in the parsing stage, and when the script finishes executing, the HTML continues to parse the code. In the image below, the ‘Parse HTML’ happens twice because parsing was stopped once, but in the optimized code, the ‘Parse HTML’ stage was not interrupted by neither CSS nor JavaScript.
Before Optimization
- CSS file not loaded in the
<head /> - JavaScript file loaded in the
<head />

After Optimization
- CSS file loaded inside of the
<head /> - JavaScript file loaded immediately before the
</body>tag - Used internal stylesheet

Minimizing the Number of Resource Requests
Resources included in the page, such as CSS, JavaScript, and images, can only be used after they have been requested to the server and downloaded. The following image shows how long it takes to request one file using the DevTools’ Network panel. The actual download time for this file was 1.03ms, and other wait time (total time spent – actual download time) was 127.45ms. It clearly takes quite some time to download even a single file, so it is important to minimize requests made to those only that are absolutely necessary. This section will further discuss minimizing the number of requests for different type of resources.

Image Sprite
In the following example, if each icon uses a different image file, total of seven resource requests must be made for the example case. Image Sprite is a method of reducing the seven requests to just one request total.

Image Sprite combines multiple images into one image, and uses CSS’s background-position attribute to display only a part of the whole image. The icons-spirte.png used in the CSS below is the sprite image. Using the Sprite method enables the page to load much faster.
<button class="btn">Confirm</button>.btn {
background-image: url(../images/icon-sprite.png);
background-position: 10px 10px;
width: 20px;
height: 20px;
}The following screenshots compare the performances of using multiple images and using a single image sprite. The performance of a version that uses the image sprite has significantly improved due to the decreased number of resource requests.
Before Optimization (Used multiple images)

After Optimization (Used an image sprite)

Bundling CSS and JavaScript
Before the developers were introduced to the modular development, developers had to import multiple external resource files. In the unoptimized example below, a total of five resource requests occur (two CSS file requests and three JavaScript file requests.) In this case, a bundler like webpack can be used to decrease the number of CSS and JavaScript requests. Bundlers combine multiple files into one, and such file is called a bundle file. (Refer to [FE Guide] Bundler for more information on modules and bundling.)
Before Optimization (Used separate resources)
<html>
  <head>
    <link href="foo.css" rel="stylesheet" />
    <link href="bar_baz.css" rel="stylesheet" />
  </head>
  <body>
    <div id="foo">...</div>
    <script async src="foo.js" type="text/javascript"></script>
    <script async src="bar.js" type="text/javascript"></script>
    <script async src="baz.js" type="text/javascript"></script>
  </body>
</html>
After Optimization (Used bundled resources)
<html>
  <head>
    <link href="bundle.css" rel="stylesheet" />
  </head>
  <body>
    <div class="foo">...</div>
    <script async src="bundle.js" type="text/javascript"></script>
  </body>
</html>
Using Internal Stylesheets
A <style> tag can be used instead of importing an external stylesheet using the <link> tag. Using the <style> tag to define the style is referred to as using internal stylesheets, and can decrease the number of requests to external stylesheets. However, internal stylesheets do not have access to the resource cache, so it is advised to only use it when the CSS is consistently included in the HTML.
Before Optimization (Using External Stylesheets)
<html>
  <head>
    <link href="bundle.css" rel="stylesheet" />
  </head>
  <body>
    <div class="foo">...</div>
  </body>
</html>
After Optimization (Using Internal Stylesheets)
<html>
  <head>
    <style type="text/css">
      .foo {
        background-color: red;
      }
    </style>
  </head>
  <body>
    <div class="foo">...</div>
  </body>
</html>
Substitute Small Images with HTML and CSS
If the number of icon images used in the webpage is relatively few, it is also possible to include the image in the HTML and CSS instead of using the downloaded image. It can be done by using Data URI, and it is used to convert the image imported using the foreign path to a Base64 URI. With Base64 URIs, the browser does not have to make a request to download the particular image. However, this method also has the same problem the internal stylesheet had with cache, so use only when absolutely necessary.
Before Optimization (Using External Images)
.btn{background: url('../img/arrow_top.png') no-repeat 0 0;}<img src="../img/arrow_top.png" />After Optimization (Image converted into Base64)
.btn{background: url('data:image/png;base64,iVBORw0KGgoAAAANSUhEUgAAAAwAAAAOCAYAAAAbvf3sAAAAAXNSR0IArs4c6QAAAHBJREFUKBVjYBimICwsLAaEsXmPGV0QqnAeUNxfW1v7/tWrVy8hq0HRgKQ4CahoIxDPQ9cE14CseNWqVUtAJoMUo2tiBFkXGRmp9/fv3zNAZhJIMUgMBmAGMTMzmyxfvhzhPJAmmCJ0Gp8cutqhwAcASWgwk+79LiQAAAAASUVORK5CYII=') no-repeat 0 0;}<img src="data:image/png;base64,iVBORw0KGgoAAAANSUhEUgAAAAwAAAAOCAYAAAAbvf3sAAAAAXNSR0IArs4c6QAAAHBJREFUKBVjYBimICwsLAaEsXmPGV0QqnAeUNxfW1v7/tWrVy8hq0HRgKQ4CahoIxDPQ9cE14CseNWqVUtAJoMUo2tiBFkXGRmp9/fv3zNAZhJIMUgMBmAGMTMzmyxfvhzhPJAmmCJ0Gp8cutqhwAcASWgwk+79LiQAAAAASUVORK5CYII=" />Minimizing the Size of Resources
A resource that is large in size also contributes to a slow loading website. It is advisable to use compressed versions of each document in order to minimize the file size and to optimize the performance.
Eliminating Redundant Codes
Let’s take the frequently used utils.js file for example. Redundant codes make the file size bigger, thereby slowing the entire loading process
Before Optimization (Included redundant codes)
// foo.js
function filter() { ... }
function map() { ... }

filter();
map();
// bar.js
function filter() { ... }
function find() { ... }
filter();
find();After Optimization (Eliminated redundant codes)
// utils.js
export function find() { ... }
export function filter() { ... }
export function map() { ... }
// foo.js
import {filter, map} from 'utils.js'
filter();
map();// bar.js
import {filter, find} from 'utils.js'
filter();
find();Be Wary of All-in-One Utility Libraries
Be extra careful when using all-in-one utility libraries like Lodash. Casually importing the entire library can drastically increase the size of the JavaScript file. Consider importing selections of the library to only include the pieces that are absolutely necessary, and avoid from using libraries that contain large amount of unnecessary codes.
Before Optimization (Importing the entire lodash library)
import _ from 'lodash';

_.array(...);
_.object(...);
After Optimization (Importing selections from the library)
import array from 'lodash/array';
import object from 'lodash/fp/object';

array(...);
object(...);
HTML Markup Optimization
HTML should be written simply, with minimal nested tags. It is also advisable to uglify the code by eliminating whitespaces and comments. The recommended number of DOM tree nodes, maximum depth, and maximum number of child-bearing parent nodes are below 1,500, 32-depth, and below 60, respectively. It is important to prevent the DOM tree from becoming too large with unnecessary markup, and thereby preventing the total file size of the HTML file from becoming too large.
Note: Excessive DOM
Before Optimization (Unnecessary tags, empty spaces, and comments)
<html>
  <head>
    ...
  </head>

  <body>

    <div>

            <div>
                <!-- blar blar blar -->
                <p>hello</p>
            </div>

    </div>
  </body>
</html>
After Optimization (Concise markup)
<html>
  <head>
    ...
  </head>
  <body>
    <p>hello</p>
  </body>
</html>
Use Concise CSS Selectors
Optimize the CSS file by using concise CSS selectors. Using classes instead of ids allows developers to deal with redundant styling collectively.
Before Optimization (Unnecessary selectors)
<html>
  <head>
    <style type="text/css">
      #wrapper {
        border: 1px solid blue;
      }

      #wrapper #foo {
        color: red;
        font-size: 15px;
      }

      #wrapper #bar {
        color: red;
        font-size: 15px;
        font-weight: bold;
      }

      #wrapper #bar > span {
         color: blue;
         font-weight: normal;
      }
    </style>
  </head>
  <body>
    <div id="wrapper">
      <span id="foo">hello</span>
      <span id="bar">
        javascript <span>world</span>
      </span>
    </div>
  </body>
</html>
After Optimization (Concise selectors)
<html>
  <head>
    <style type="text/css">
      .wrapper {
        border: 1px solid blue;
      }

      .text {
        color: red;
        font-size: 15px;
      }

      .strong {
        font-weight: bold;
      }

      .wrapper .text {
        color: blue;
        font-weight: normal;
      }
    </style>
  </head>
  <body>
    <div class="wrapper">
      <span class="text">hello</span>
      <span class="text strong">
        javascript <span class="text">world</span>
      </span>
    </div>
  </body>
</html>
Minify
All of HTML, JavaScript, and CSS can be compressed in the production stage, and unnecessary whitespaces and comments should be eliminated and minified. This can be done with tools like webpack plugins.
Webpage Rendering Optimization
In order to render the webpage, DOM and CSS are required. However, since JavaScript is often used to generate variety of effects and functionalities, it is critical to acknowledge how JavaScript affects the rendering performance. Also, since JavaScript works as a single-thread in the browser, the rendering performance is directly correlational to JavaScript performance. Render time includes all of time it takes to execute JavaScript, and the time required to repaint the results of DOM and CSS changes caused by JavaScript. Rendering performance optimization requires optimizing the time spent on such activities and continuing to provide the users with visual content. This section will now discuss which parts of the webpage rendering process affect the performance, and especially, how a piece of JavaScript code can affect the rendering performance.
Layout Optimization
The Layout stage in the rendering process is the stage where the DOM elements are calculated for their positions and sizes on the screen. If JavaScript code changes the DOM or the style, the engine must apply the style changes and perform the calculations again to finally be able to render the page. Since this process has to calculate every element including each font-size with respect to other elements, it takes a long time.
 (Image Source : Rendering Performance)
The purpose of layout optimization is to minimize the time required to perform a layout and to ensure that the layout stage happens as little as possible. Let’s explore how to achieve such goals by optimizing JavaScript, HTML, and CSS.
JavaScript Optimization
If the JavaScript run-time takes a while, the rendering performance is damaged because each frame takes longer to be processed. If the JavaScript has numerous tasks to accomplish, it is only logical that it takes a while, but the problem occurs when the codes are simple with unnecessary layout triggers, thereby causing performance drops. It is important to minimize the changes made to DOM and style in order to prevent unnecessary layouts from occurring.
Forced Synchronous Layout Optimization
If a DOM property is changed, a layout can occur for the sake of a screen update. Initially, layouts can happen asynchronously, but it can be forced to occur synchronously in special circumstances. Such circumstances include reading the property values of a certain element. In order to retrieve the most recent value, the browser will force a layout, and this is called a forced synchronous layout. Forced synchronous layout adds to the JavaScript run-time, so it is generally recommended to avoid it. Listed below are possible circumstances that could cause forced synchronous layouts, and corresponding optimization methods.
Avoid Forced Synchronous Layouts
Forced synchronous layouts occur when trying to retrieve computed values using methods like offsetHeight or offsetTop after having changed the styles.
const tabBtn = document.getElementById('tab_btn');

tabBtn.style.fontSize = '24px';
console.log(testBlock.offsetTop); // Synchronous layout is forced internally immediately before calling the offsetTop
tabBtn.style.margin = '10px';
// Layout
If the style changes made before returning the values have not yet been applied, the functions retrieve outdated values and force a synchronous layout. Forced synchronous layouts happen even in the most modern browsers, so it is important to simply not use any code that could force synchronous layouts.
Avoid Layout Thrashing
If forced synchronous layouts happen over and over again within a single frame, the performance drops significantly. The following code iterates through paragraph[i] and configures the area of the box element to match that of the paragraph[i]. If the style.width is configured, and box.offsetWidth is executed within the same loop, layout occurs every time the loop is executed. This phenomenon is called the layout thrashing. Retrieving the width of the box element from out of the loop can prevent layout thrashing.
function resizeAllParagraphs() {
  const box = document.getElementById('box');
  const paragraphs = document.querySelectorAll('.paragraph');

  for (let i = 0; i < paragraphs.length; i += 1) {
    paragraphs[i].style.width = box.offsetWidth + 'px';
  }
}
// Code improved to prevent layout thrashing
function resizeAllParagraphs() {
const box = document.getElementById('box');
const paragraphs = document.querySelectorAll('.paragraph');
const width = box.offsetWidth;
for (let i = 0; i < paragraphs.length; i += 1) {
paragraphs[i].style.width = width + 'px';
}
}Note : What forces layouts/reflows
Manipulate the Lowest DOM Node Possible
When a DOM is changed, style calculations, layout, and paint stages have to start all over again. If the element is nested deep inside of other nodes, the engine takes longer to reach it, and the time required to update each frame increases.
Check Point
- When the style of the parent nodes in the DOM tree are changed, it affects the child nodes as well.
- Minimizing the scope of manipulation minimizes the scope of the layout.
Restricting the Affected Elements
In some cases, a certain change in the DOM or style affects nearby elements, causing extra layouts of the neighboring elements.
Check Point
- Parent-child relationships: If a child’s height is changed while the parent’s height is mutable, a layout starts all the way from the parent element. In this case, if the parent element’s height is fixed, elements under the parent node will not be affected. For example, if there are multiple tab contents with different heights, having a fixed height for the parent (the tab container) will make it so that the area of effect is minimized.
- Elements with same positioning: If multiple elements are placed
inline, a change in thewidthof a first element will cause position changes in rest of the elements.
Editing the Hidden Elements
If the element has display: none style, layouts and repaints do not happen even if the DOM and the style have been changed. If it is necessary to change multiple elements at once, hide them first, and then make them visible in order to minimize the layout occurrence. visibility: hidden does not cause repaints because it is not visible, but does cause layouts because it does take up space.
Check Points
display: noneis good for performance because it does not cause any layouts and repaints.
HTML and CSS Optimization
HTML and CSS are indispensable for rendering, and they are responsible for constructing DOM Tree and CSSOM Tree, respectively, during the rendering stage. Changes to the DOM tree and the CSSOM tree causes rendering, and bigger the tree, more complicated are the calculations. Therefore, optimizing the HTML and CSS code can have a positive effect on the rendering performance.
Minimize the Number of CSS Rules
Rendering happens when an element’s class has been changed, and the calculations and layouts take longer if the CSS is more complicated, or if there are too many rules.
Check Point
- Fewer rules result in faster calculations, and therefore, rendering.
- Refrain from using complicated selectors because they negatively affect the style calculation time.
Minimize the Depth of the DOM
Deeper DOM trees or a DOM tree with too many children attached to each node, force the tree to become large. Bigger DOM trees require more calculations for each update.
Check Point
- Smaller DOM Trees result in faster calculations.
- Remove unnecessary wrapper elements.
Animation Optimization
A single frame must be processed within 16ms (60fps) in order for it to be rendered naturally. This means that JavaScript is allowed around 10ms to be processed, as to, including the time it takes to execute layout, paint, and etc., meet the 16ms limit. While animations can be implemented using both JavaScript and CSS, it is recommended to use CSS instead of the native JavaScript.
Using requestAnimationFrame()
requestAnimationFrame API allows the developers to match the browser’s frame rate (usually 60fps) to run the animation. Especially, unlike setInterval or setTimeout, it is called when the animation starts, so it can be executed consistently and periodically. Also, if the current section of the page is not being displayed, the callback function is not called, thereby saving memory by not performing unnecessary tasks.
function animate() {
  // Run Animation
  requestAnimationFrame(animate);
}

requestAnimationFrame(animate);
Using CSS Animation
Animations handled with JavaScript can lead to poor performance. CSS3 Animation on the other hand, does not require JavaScript to be executed, and is optimal to be executed within the browser because CSS based animations are not affected by the main thread which leads to smoother implementation of the animation. CSS3 Animations can be used, while adhering to the following rules, can present fluid animation on browsers.
position: absolute
It is imperative that the animation does not affect the nearby elements. If the position is set to absolute or fixed, it does not affect the neighbors.
transform
Layouts occur when style changes that instigate geometric changes, like position, width, and height occur. Elements affected by CSS's transform property are separated into layers, thereby limiting elements subjected to layouts and paints. Also, because transform only instigates compositing stage, it could improve the rendering speed when using animations. If the hardware supports the use of GPU, it could very much improve the performance. For example, using properties like left and top force compositions in every frame, so it is better to use transform: translate().
body {
  background-color: lime;
}

.animation-item {
  position: absolute; /* good */
  top: 0;
  left: 0;
  width: 50px;
  height: 50px;
  background-color: red;

  animation: move 3s ease infinite;
}

/* bad */
@keyframes move {
  50% {
    top: 100px;
    left: 100px;
  }
}

/* good */
@keyframes move {
  50% {
    transform: translate(100px, 100px);
  }
}
Afterword
So far, this document has explored ways to optimize the performance of web applications. The best way to go about optimizing the web application is to understand the browser-loading and rendering processes and eliminating the unnecessary steps along the way. The author hopes that readers refer to this guide to apply optimization methods in their own projects to provide performant service to users.
This document is an official Web Front-End development guide written and maintained by NHN Cloud FE Development Lab. Any errors, questions, and points of improvement pertaining to this document should be addressed to the official support channel (dl_javascript@nhn.com).
| Last Modified |
|---|
| 2019. 04. 08 |